
Data Visualisation in Ryijy
In a move I did not see coming when I started taideryijy (rya) weaving, I stumbled into data visualisation. I have a collaborative textile art and mechanical engineering project with Aalto University Professor Sven Bossuyt (that I hope to get funded and develop). Currently a sample of it is at the Aalto University exhibition “Dialogues - Creating New Textile Futures”, that presents collaborative projects involving textile development and innovation with various science fields.
Virtual exhibition: https://virtualexhibitions.aalto.fi/en/dialogues-creating-new-textile-futures
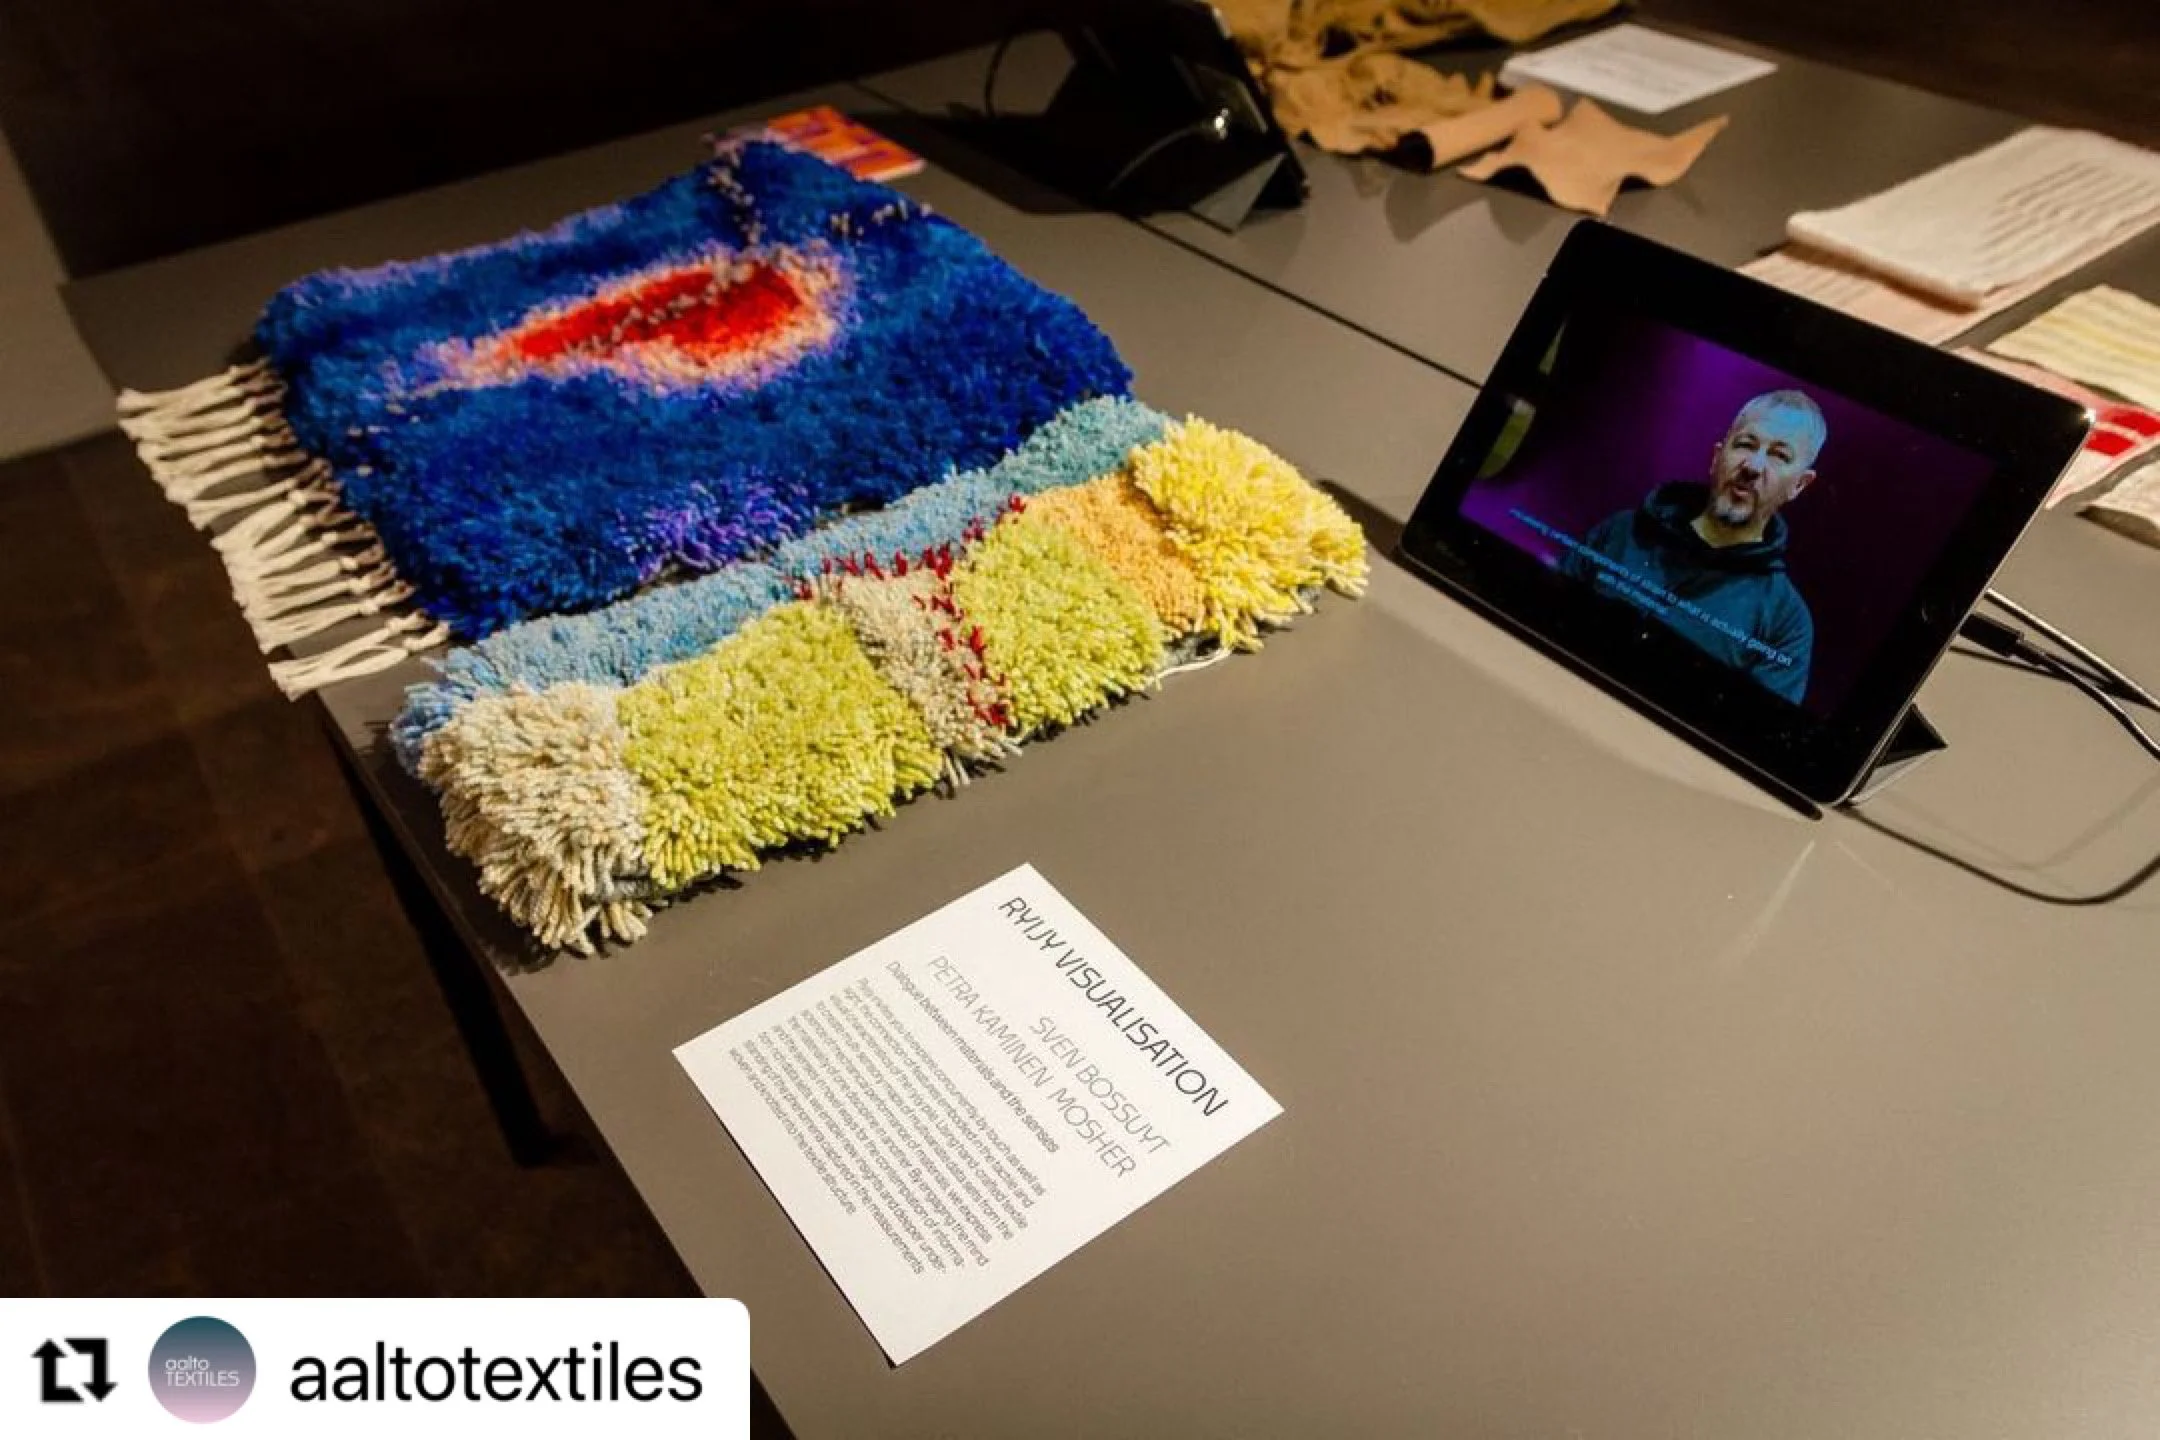
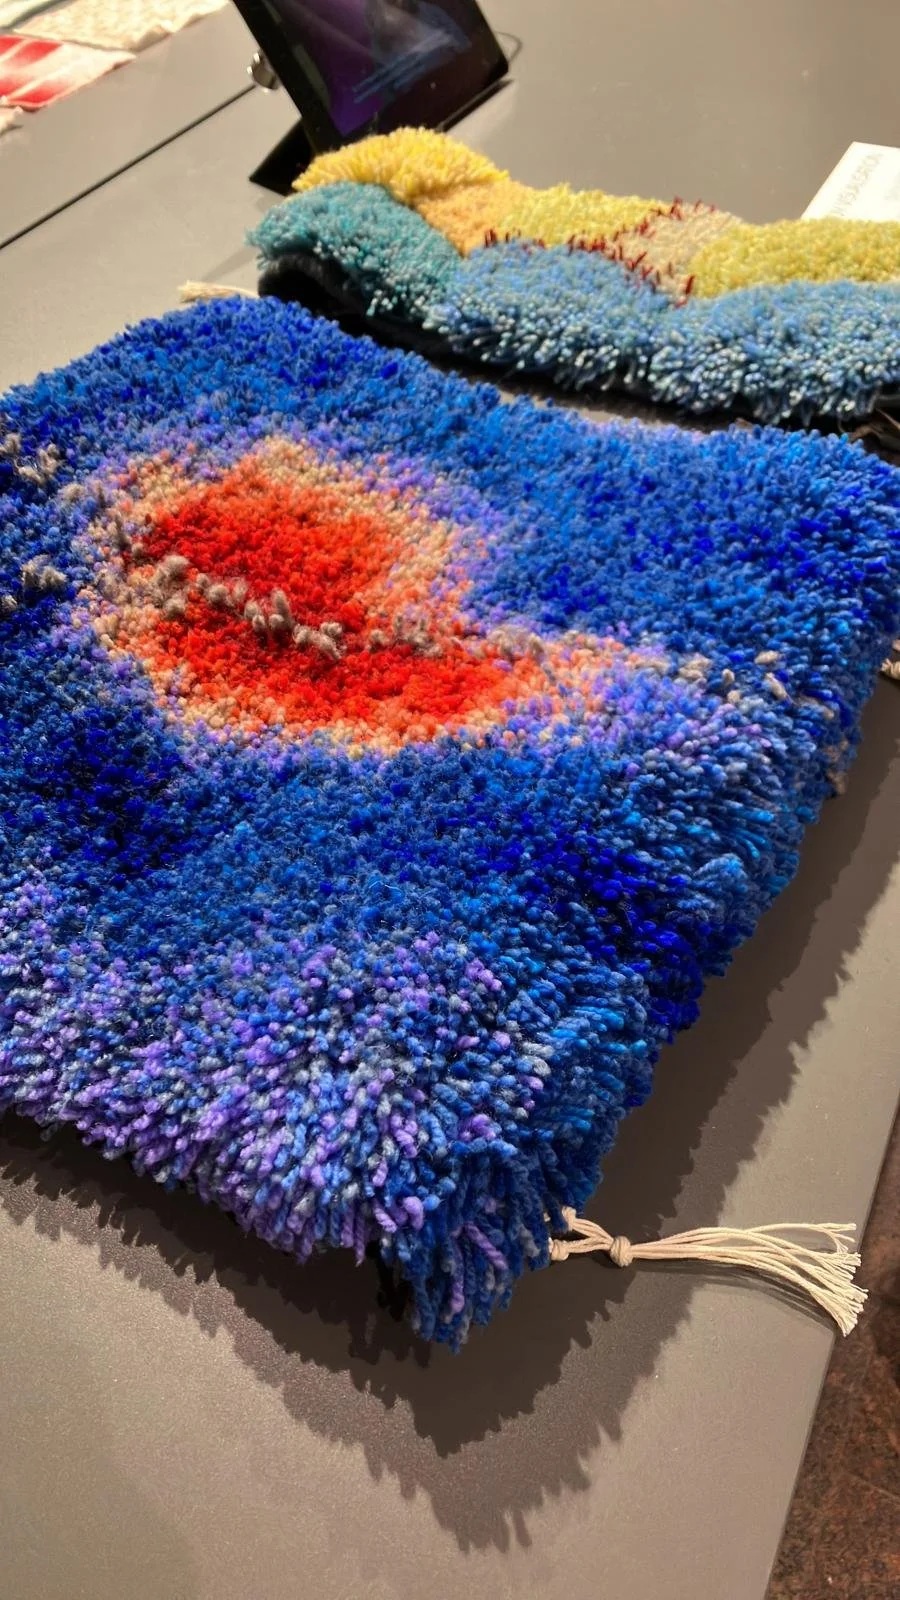
Screenshots of IG post from AaltoTextiles account: Close-up image of table with two samples of ryijy (rya weaving), one in reds and blues, and the other in light green, teal, and grey with a touch of red.
Text: Sven Bossuyt and Petra Kaminen Mosher: Ryijy Visualisation
Dialogue between materials and senses. Photos by Helmi Korhonen (IG: @helmikorhn)
Dialogues exhibition open 28.11.2022 - 28.02.2023 in Dipoli, Aalto University, Espoo (Finland).
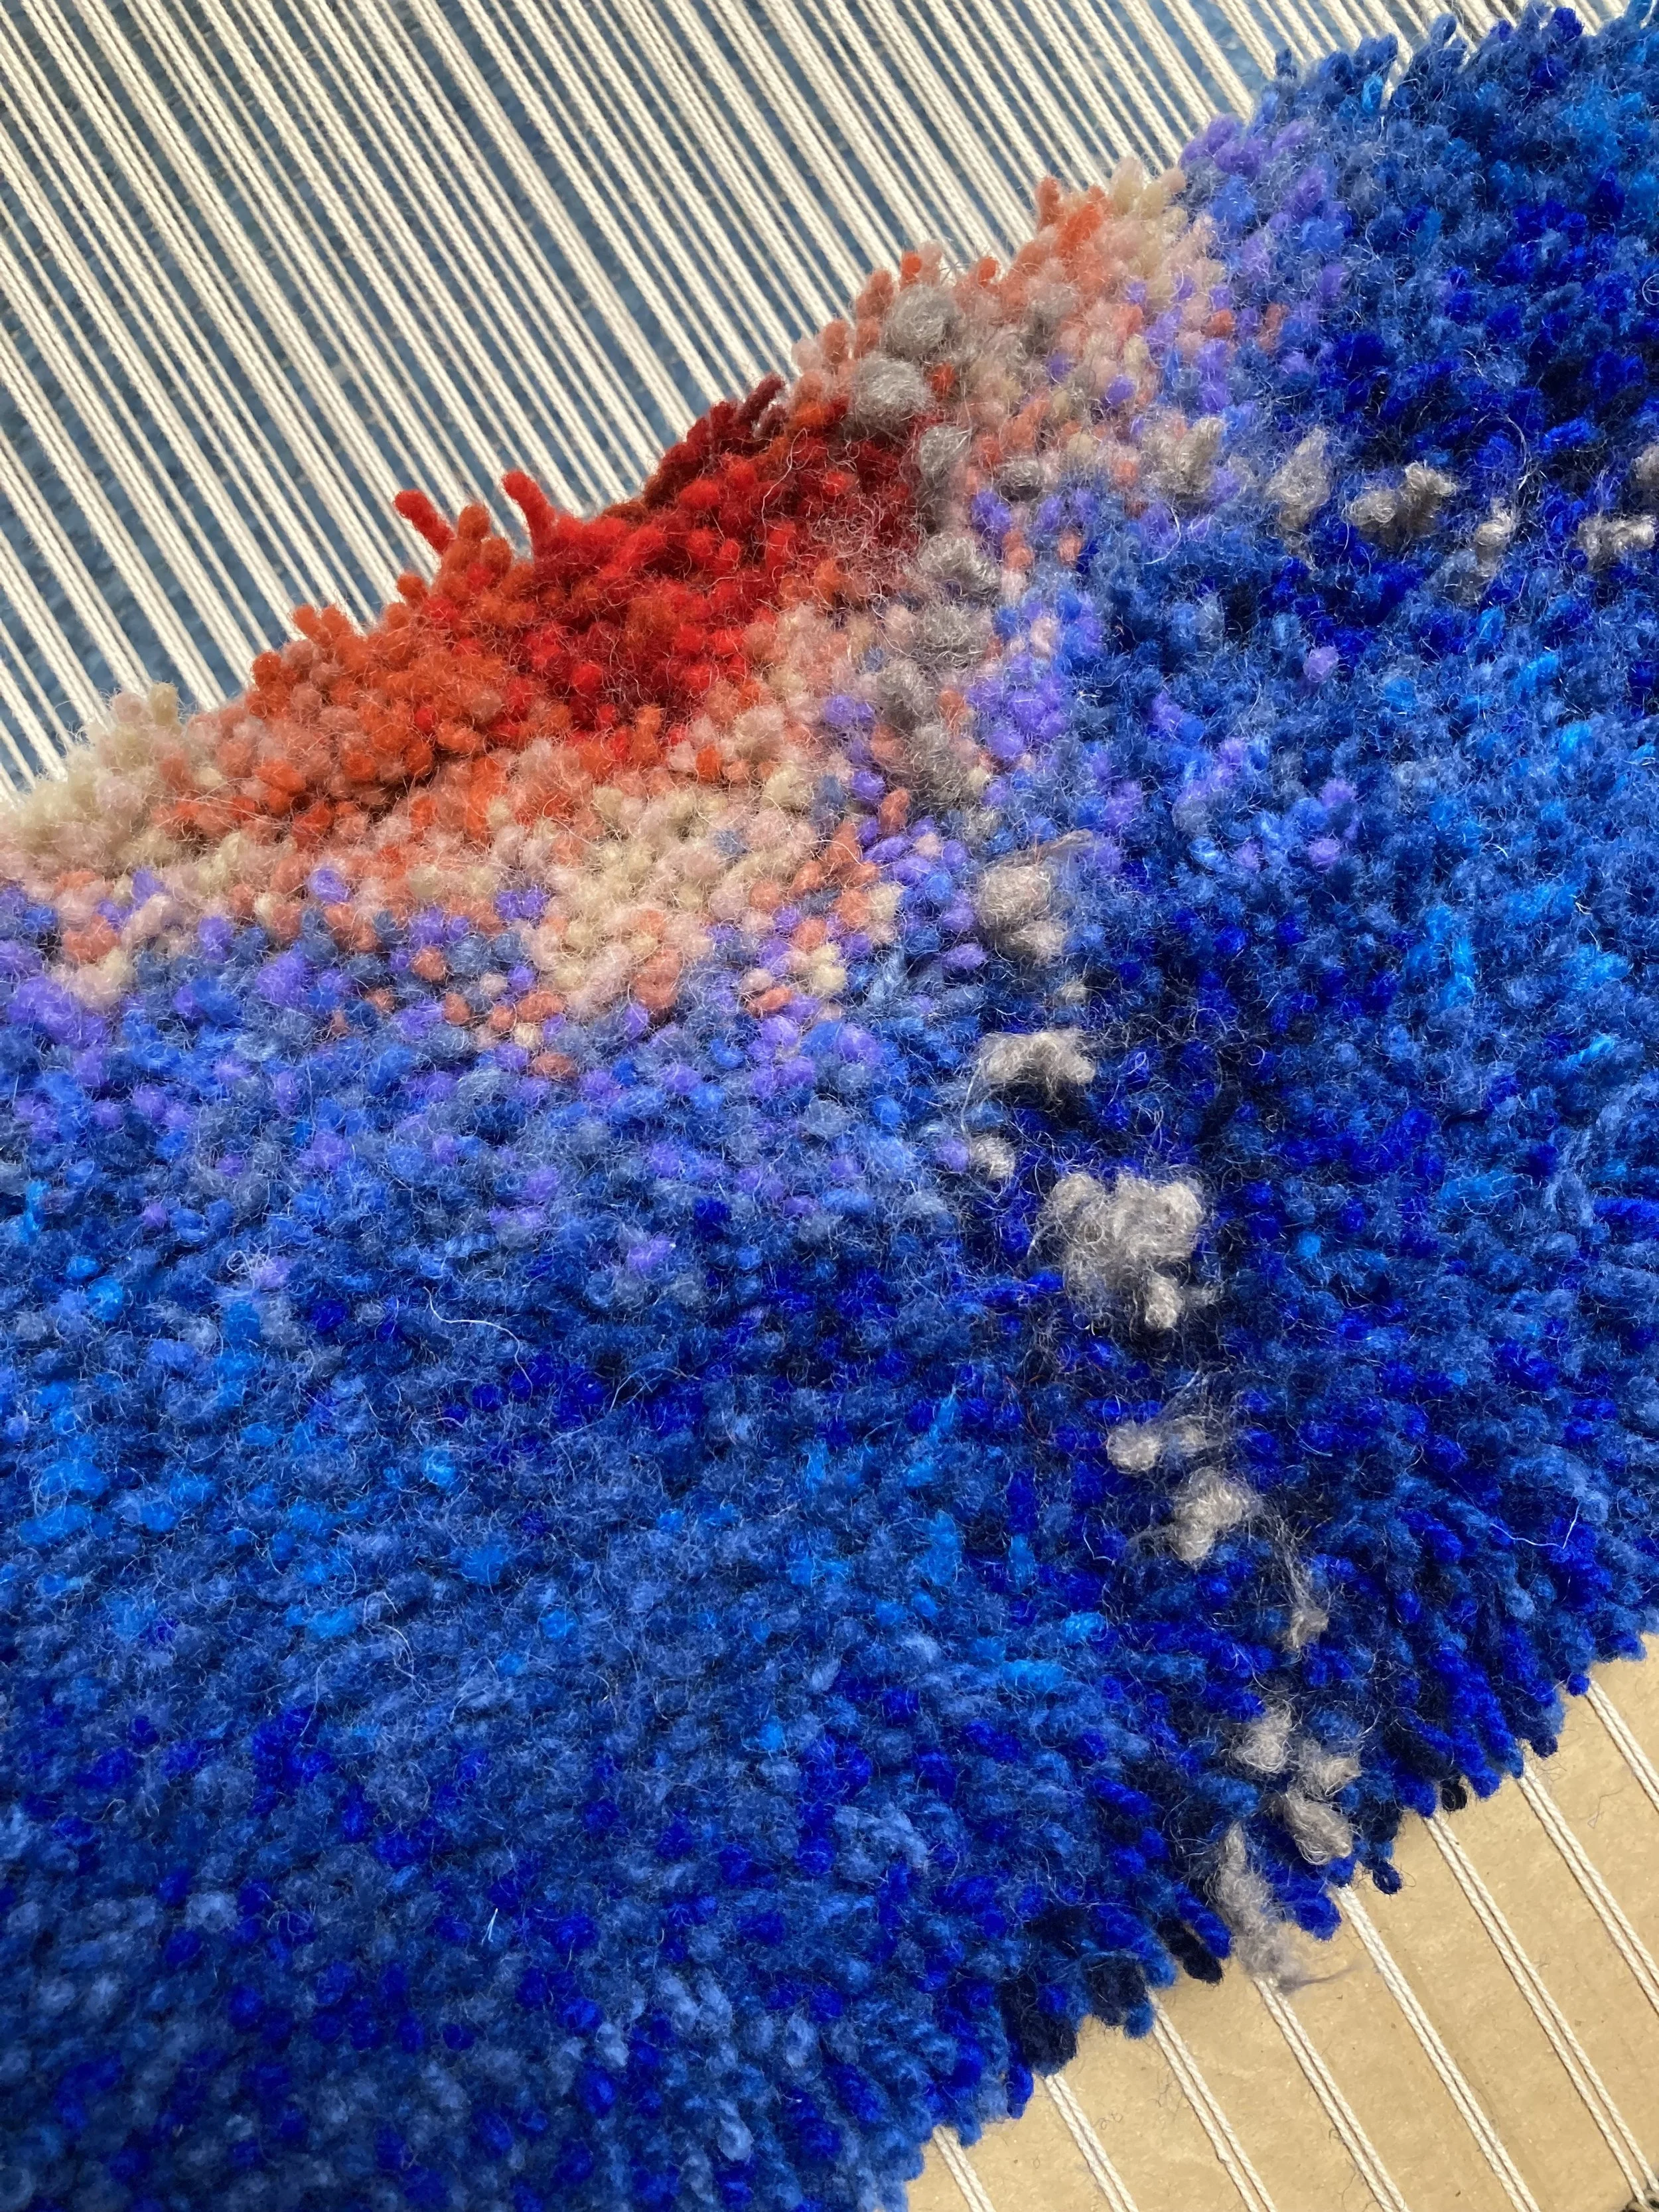
Close-up detail of area of ryijy that shows that corresponds to a small area of strain accumulation.